Splunk is an amazing tool to aggregate logs, parse them and display metrics from all your Information System. The learning curve is quite smooth. However, the current official documentation of such a modular system might complicate the first approach a bit. Here are some landmarks.
General idea and architecture
As many other logs indexing systems, Splunk rely on two main components.
Splunk forwarder
| Splunk | ELK | Loki |
|---|---|---|
| Splunk universal forwarder | Filebeat | Promtail |
function
Splunk universal forwarders (SUF) are simply low footprint agents whose main responsibility is to:
- watch for new lines in log files discovered in folders (a kind of
tail -f, if you will) - attach new labels to this
_rawdata - send it to an indexer for further processing
[Important precision] Splunk universal forwarders do not process data but merely send it. Splunk heavy forwarders – which are no more no less than Splunk Enterprise instances configured to forward data to other instances – do.
configuration
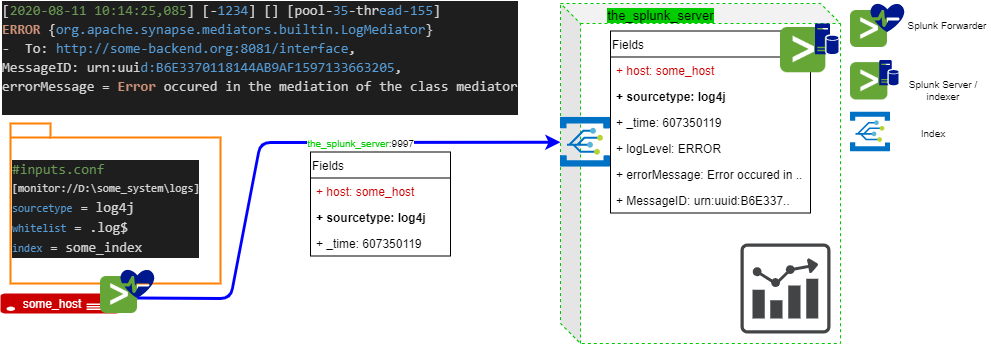
Somewhere in $SPLUNK_HOME/etc/apps/SplunkUniversalForwarder/local/inputs.conf, you would add
[monitor:///var/log/some_java_system]
sourcetype = log4j
followTail = 0
whitelist = .log$
index = some_index
blacklist = (http_access|audit)
to monitor all files with .log extension, ignoring any *http_access* or *audit* files, labeling this data as generated by log4j to be written to some_index. To send it to a Splunk instance server (say, located at 10.155.84.123), just add the following to $SPLUNK_HOME/etc/apps/SplunkUniversalForwarder/local/outputs.conf
[tcpout]
defaultGroup = default-autolb-group
compressed=true

[tcpout:default-autolb-group]
server = 10.155.84.123:9997

[tcpout-server://10.155.84.123:9997]
Splunk server / indexer
The indexer simply
- listen to port 9997 (by default)
- extract fields according to the event’s
sourcetype(and / or customprops.conf) - store everything in a database
In the example depicted above, since the sourcetype is log4j, Splunk would quite spontaneously extract To and MessageID based on pattern identification. No regex are required. For logLevel, you might need to customize your app’s props.conf (see below).
Dockerized testing environment
Here is a simple docker-compose.yml to experiment with Splunk
version: "3.7"

services:
  splunk:
    image: splunk/splunk:8.0.4
    container_name: the_splunk_server
    ports:
      - 8000:8000
    environment:
      - SPLUNK_START_ARGS=--accept-license
      - SPLUNK_PASSWORD=admpassword
    networks:
      - monitoring_network

  forwarder:
    image: splunk/universalforwarder:8.0.4
    container_name: forwarder
    environment:
      - SPLUNK_START_ARGS=--accept-license
      - SPLUNK_PASSWORD=someclient_password
      - SPLUNK_STANDALONE_URL=the_splunk_server
    networks:
      - monitoring_network
    volumes:
      - /path/to/log/directory:/var/log/some_application:ro
      - ./inputs.conf:/opt/splunkforwarder/etc/apps/search/local/inputs.conf

networks:
  monitoring_network:
For the the SUF to parse and send logs from /path/to/log/directory, simply mount the following inputs.conf
#inputs.conf
[monitor:///var/log/some_application]
disabled = false
You can then visit http://localhost:8000 using admin and admpassword
What makes a Splunk app a Splunk app?
- it is deployed on
$SPLUNK_HOME/opt/splunk/etc/apps - it contains dashboards but also
- custom REGEX fields extractions (created in
props.conf) - navigation parameters
- mapping tables (for lookups)
- macro functions
- what you would typically find in any web application (icons, css, js)
- custom REGEX fields extractions (created in
Though entirely customizable, I found it easier to start with a clone of Splunk’s default search application (you’ll find it somewhere in $SPLUNK_HOME/opt/splunk/etc/apps)`. Just copy it with a different name and mount it to start working.
version: "3.7"

services:
  splunk:
    image: splunk/splunk:8.0.4
    container_name: the_splunk_server
    ports:
      - 8000:8000
    environment:
      - SPLUNK_START_ARGS=--accept-license
      - SPLUNK_PASSWORD=admpassword
    networks:
      - monitoring_network
    volumes:
      - ./your_app:/opt/splunk/etc/apps/your_app
Here is how an app is structured
your_app:
    - appserver
    - bin: python scripts
    - default: don't touch this, won't change a thing but give you the proper structure for /local
    - local:
        - data:
            - ui:
                - nav
                - views: your dashboards XML are here
        - fields.conf: determine which fields are indexed or extracted (impact performance)
        - macros.conf
        - props.conf: custom REGEX to extract fields that Splunk would miss
        - transforms.conf: transform data (obfuscation, setting lookups....)
    - lookups: your mapping tables are here
    - metadata
    - scripts
    - static: the app's icons are here